The web scraping industry has a benchmark problem
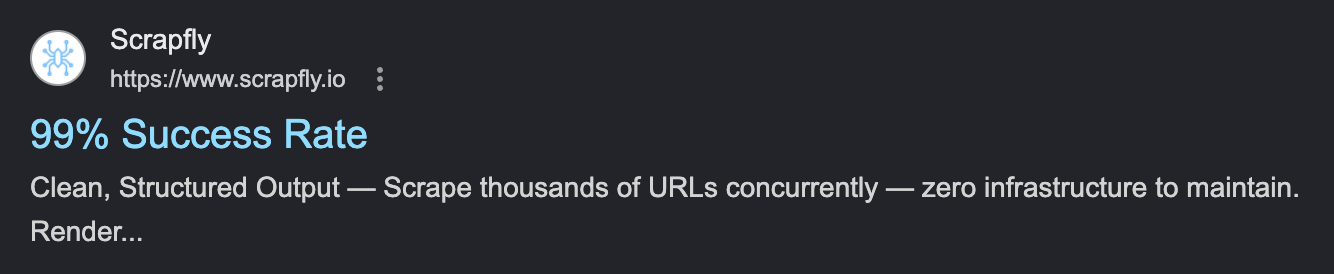
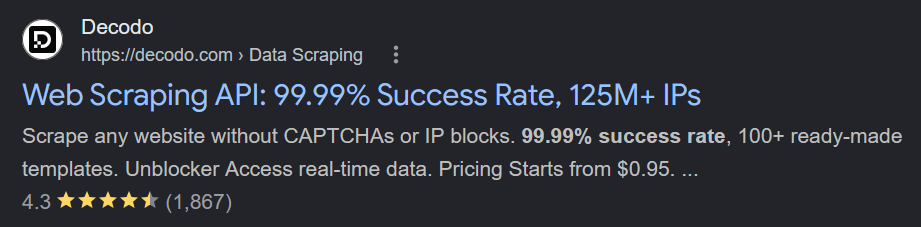
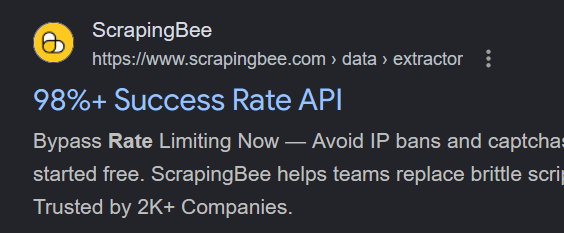
These can’t all be true
Vendor marketing and published rankings, captured July 2026.
Ask any web scraping vendor about their success rate, and they will show you their published benchmark, landing them somewhere between 98% and 100%. These aren’t lies. They’re just selective truths. We are also a web scraping vendor, but we want you to trust us. So we built an open-source benchmark, the one we’ve always wanted to exist: an open target set and open harness, 15 providers, 6,750 live requests, and results anyone can reproduce or dispute. And what’s more, we commit to maintaining it monthly.
Problem one: bias
When a web scraping vendor publishes a benchmark, they are controlling which URLs get tested, how success is defined, how retries are handled, what configuration credits run with, and nobody publishes the harness. You can’t check it. You can’t know the truth.
A 99% from one vendor and a 98% from another describe two different tests, not two products. It’s unfalsifiable. There’s nothing to check, so that’s how the screenshots above can all exist at once. That’s the honest problem.
Some companies play a little dirtier. Two of the top results when you google, or ask a chatbot, for independent scraper benchmarks are Scrapeway and ScrapingTest. Scrapeway advertises independent benchmarks with “no affiliate links, no sponsors, just data”; ScrapingTest brands itself an “independent web scraping benchmark.” Each ranks a single provider first. Scrapeway’s domain traces back to Joam Intelligence, LLC, the company behind Scrapfly, its number one. ScrapingTest is registered to Batuhan Özyön, the founder of Scrape.do, its number one. Even the word independent is not a signal you can rely on.
Problem two: breadth
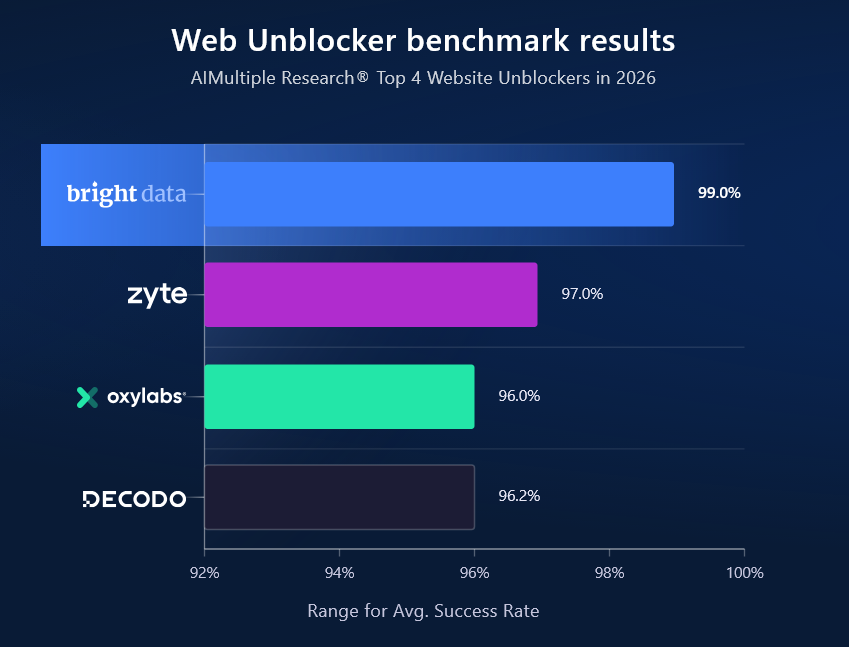
The genuinely independent benchmarks are scarce. Proxyway and AIMultiple were the only ones we could find published this year; both use affiliate links. They are still the closest thing the industry has to neutral measurement.
Proxyway: They tell vendors ahead of time what the test will be. They only test a handful of companies, and their suite only covers 15 sites. With roughly one site per anti-bot vendor, a single leniently configured deployment becomes the entire grade for DataDome, Kasada, or Akamai. Their own 2024 write-up said as much about Indeed, which is protected by Shape: “We either failed to trigger it or Indeed is using a lenient configuration.”
AIMultiple: They ran in May of this year and cover quite a few sites, but they report anti-bot results only for Cloudflare, PerimeterX, and DataDome. Their target list includes Akamai-protected sites without reporting Akamai as a category, and Kasada and Imperva are not touched at all.Update · August 10, 2026After we published this post, the AIMultiple team contacted us to notify that they added this breakdown to their benchmarks. That’s great to see! They also do not cover a variety of industries: no airlines and flights, financial market data, news publishers, live-event ticketing, electronic components, telecom carriers, automotive listings, healthcare and drug pricing, government sites, or B2B software reviews.Update · August 10, 2026We’ve been in touch with AIMultiple after publishing this post, and in their latest run, they tested across the top 10k domains from Tranco, covering more industries. This will be helpful! We think the value of having an industry breakdown is to compare vendors across industries, which is why in our public repo, you can see how each provider performs across each industry vertical, which will help you identify the best provider for your use case.
Both of these providers use affiliate links or charge companies to be listed on their sites. If you pay AIMultiple, your product gets a link on its name and, on lists without product performance data, a spot at the top. They say so on their site. Both companies have limited benchmarks (only 5 providers each on the two benchmarks we’re referencing) because their business model depends on companies paying them for placement. They are not incentivized to add companies (like us!) if they think that those companies might pay them in the future. As of writing, AIMultiple’s Web Unblocker benchmark only shows 5 providers. Proxyway’s 2026 unblocker ranking only features 5.
There’s not a single comprehensive benchmark out there. There’s nothing that anyone can reproduce, run, test, and update on their own.
So we built one
The Web Data Frontier Benchmark is an open-source suite of 90 real sites - Amazon, Walmart, Zillow, Ticketmaster, and 86 others - run through one fixed harness that gives every provider identical URLs.
The pass criteria are binary: the request must come back successful and the body must contain a known marker, like a product title, that would not appear on a block page. Five attempts per site, per provider. The target list, the success markers, and the per-provider adapters are all in the repo, and a run emits the machine-readable output.json that every number in this post is generated from. The same marker check is the first step in checking that scraped data is complete and accurate.
Firecrawl open-sourced a similar effort about seven months ago, scrape-evals, with a public write-up of the results. Since then the repository and the blog post have been taken down, and what remains visible is the CI workflow that now runs the evals privately. We mention it as precedent rather than criticism - keeping a public benchmark current is real, ongoing work. We commit to maintaining a monthly benchmark so that our work can be evaluated, criticized, and measured.
Methodology
The set spans every major anti-bot vendor (Akamai, Cloudflare, DataDome, Kasada, PerimeterX, AWS WAF) along with sites that run their own defenses, like Google, LinkedIn, and Temu. On each site we target a high value page: a product page, search results, listings, or reviews - the pages people actually scrape.
Every provider is run in the strongest anti-bot mode it offers - the premium or stealth tier, not the default - and the exact request shape for each one lives in an adapter file in the repo, so the configuration is auditable rather than taken on faith. Requests go out live with a 90 second timeout, 5 attempts per page, and at most two concurrent requests per provider with 500ms between dispatches, so no provider is rate limited by test pressure and a miss is attributable to the target rather than the harness.
A pass requires more than a successful status code. A 200 that returns a captcha interstitial or an empty JavaScript shell is a failure: the response body must contain a marker - a product title, a listing address - that only appears on the real page. An error status, a timeout, or a body without the marker all count as failures. The run makes real, billable API calls against every provider; we bought the competitor credits ourselves.
Results
The full leaderboard, verbatim from the run’s output.json (completed July 15, 2026 - treat every number here as a snapshot of that date). The range is wide: success rates span 33.3% to 95.8%, with the middle of the field clustered between 65% and 80%. None of these numbers are perfect, ours included. We completely failed on two sites. Against targets selected to be difficult, they should not.
| Rank | Provider | Success rate | Latency score | Passed |
|---|---|---|---|---|
| 1 | String | 95.8% | 11.07s | 431/450 |
| 2 | Scrapfly | 83.6% | 14.28s | 376/450 |
| 3 | Bright | 80.9% | 24.33s | 364/450 |
| 4 | Context.dev | 78.7% | 13.62s | 354/450 |
| 5 | Firecrawl | 70.9% | 14.70s | 319/450 |
| 6 | ScraperAPI | 69.3% | 13.31s | 312/450 |
| 7 | Oxylabs | 68.9% | 20.85s | 310/450 |
| 8 | Zyte | 68.2% | 17.50s | 307/450 |
| 9 | Decodo | 67.8% | 29.74s | 305/450 |
| 10 | Nimble | 59.3% | 21.43s | 267/450 |
| 11 | Browserbase | 50.0% | 15.25s | 225/450 |
| 12 | ZenRows | 44.2% | 21.35s | 199/450 |
| 13 | ScrapingAnt | 35.1% | 15.46s | 158/450 |
| 14 | Scrapingdog | 35.1% | 15.01s | 158/450 |
| 15 | ScrapingBee | 33.3% | 18.15s | 150/450 |
The latency score. Compare it with success rate: a fast failure is still a failure. The score gives each target equal weight: targets with content use the p75 successful-attempt time, while complete misses use the p75 among providers that returned content for that target. Browserbase scores 15.25s while passing half its requests; speed means little when the payload is a block page. Decodo scores 29.74s while passing 67.8%. The upper left corner is the one that matters: String scores 11.07s while passing 95.8% of requests.
Success by anti-bot vendor
Averages hide where each provider actually breaks, so the same run sliced by the anti-bot system defending each target is more informative.
Kasada separates the field most sharply: ScraperAPI and Scrapingdog passed 0% of Kasada-protected requests and ScrapingBee 6.7%, while four providers cleared it at 93% or above.
Cloudflare shows a similar split, with Nimble at 15.4% and Browserbase at 10.8%. String passed 100% of requests against DataDome, AWS WAF, and Kasada targets; our weakest category was PerimeterX at 86.7%, where Scrapfly passed 91.1%.
One caveat to read with the chart: Kasada covers three targets and AWS WAF six, so a single site moves those columns more than it moves DataDome’s nineteen.
Success by industry
Slicing by vertical shows how unevenly the frontier is distributed. News and finance pages are broadly reachable, while live-event ticketing is the hardest vertical in the set: across Ticketmaster, SeatGeek, and StubHub, Decodo and ZenRows passed 0% of requests and Bright 6.7%. Social platforms split the field in a different place - Firecrawl passed 10% there while clearing real estate at 97.1%.
This is the case for breadth: a single overall number flattens exactly the differences that decide whether a provider fits your use case.
Where we failed
An honest benchmark cuts both ways, so here is our own failure ledger for this run: 19 of 450 requests. Two targets account for half of it. We totally failed on Temu and Skyscanner. Temu went 0 for 5 - it serves a custom interactive captcha that we do not yet solve (support is coming to the Web Access API). Skyscanner also went 0 for 5 behind PerimeterX. The remaining nine misses were scattered timeouts and rate limits across five sites we otherwise passed, including Instacart and Crunchbase. We do not bill for misses like these either: under String’s pricing, you only pay when a request returns content.
Numbers like these are the entire point of the benchmark. A published 100% means the test set stopped being hard; the failures are what tell you where the frontier actually is.
Limitations
A few things to read this with. It is a snapshot in time: anti-bot defenses and provider capabilities both change monthly, and these numbers will drift. Ninety sites is far more coverage than the independent benchmarks manage, but it is not the whole web. And while every provider was run in its strongest anti-bot mode through its standard API, a provider might do better on a given site with hand-tuned, site-specific configuration than any general benchmark can show.
Then the obvious one, in plain words: we built this benchmark, and we sell the product that ranks first in it. We have tried to answer that the only way that actually works - by publishing the harness, the targets, the success criteria, and our own failures - but the remedy for any remaining doubt is not to take our word for it. It is to run the suite.
We are not asking you to trust. We are asking you to verify. Reproduce it or prove us wrong.
Reproduce it, or prove us wrong
The quick start in the repo takes your own API keys and emits an output.json in the same format behind every chart on this page. Fair warning: a full run makes thousands of billable API calls across every provider you test.
If we misconfigured your product, open a pull request against your adapter and we will rerun it. If there is a site you think belongs in the set, open an issue - we are happy to run suggested targets and add them. And if your numbers come out different from ours, publish them; that is what an open harness is for. Email us at support@usestring.ai.
- After we published this post, the AIMultiple team contacted us to notify that they added this breakdown to their benchmarks. That’s great to see!
- We’ve been in touch with AIMultiple after publishing this post, and in their latest run, they tested across the top 10k domains from Tranco, covering more industries. This will be helpful! We think the value of having an industry breakdown is to compare vendors across industries, which is why in our public repo, you can see how each provider performs across each industry vertical, which will help you identify the best provider for your use case.
Cheers,
String team